Monitoring Concept — TOGETHER Platform
Status: Draft Author: Martin Riemann Date: 2026-07-20 Stakeholders: Platform / Operations, Architecture, Development Leads, Security / Compliance
🤖 Generated with Claude Code
✅ Reviewed by Martin Riemann
Co-Authored-By: Claude (noreply@anthropic.com)
A platform-wide concept for monitoring, alerting, and dashboarding across on-premises Windows servers, ASP.NET/IIS applications, and Azure resources. The goal is a single, streamlined model that replaces today's scattered island solutions and gives every developer an unambiguous answer to two questions: "where do my signals go?" and "when does a human get woken up?".
| Field | Value |
|---|---|
| Scope | Servers of the TOGETHER platform, Azure App Services, and key external dependencies |
| Environments | Together-Prod (full), Together-Fachtest (partner-relevant, lighter) |
| Data collection | Largely solved — see monitoring-logging.md |
| Platform / audit logging | Separate concern — see audit-log-strategy.md |
| Related evidence | windows-event-log-review-2026-05.md; a related, in-flight logon-monitoring proposal |
| On-prem monitoring app | tis.monitoring.dashboard (evaluated below) |
How this document relates to what already exists. Data collection is in good shape (Application Insights everywhere, structured logs to Log Analytics, IIS/Windows Events via AMA/DCR). This concept does not rebuild that plane. It defines the detection, visualization, notification, and response layers on top of it, plus an application health standard — the parts that are currently fragmented or missing.
Problem Statement
Background — why now
Monitoring on the platform grew organically. Every capability was added when a specific incident demanded it, by whoever was closest to the problem, using whatever tool was at hand. The collection layer matured into something solid; the layers above it did not. There is no shared definition of what to alert on, no shared place to look, and no shared way to notify. With no rule to follow, whoever adds a piece of monitoring invents their own approach — and this is not a newcomer problem: the team turns over rarely, so it is the long-time developers doing it, simply because there are no clear rules to follow. That is how islands multiply.
Pain — the current state
The gaps sit above data collection. The centre of gravity is on-premises: the platform's most important workloads run on-prem (Windows/IIS applications and SQL Server) and send their telemetry to Application Insights. The Azure-native alerts are a secondary, largely accidental layer — Together-Prod carries roughly thirty hand-built metric and log alerts spread across about a dozen action groups, and almost all of them watch infrastructure, not the application logs that matter most; Together-Fachtest has effectively none. The real problems:
- Notification is scattered across at least four mechanisms. Azure action groups, a Logic App (
ActionGroup-LogicApp), a Teams channel group (Info Team Kanal), and — separately — thetis.monitoring.dashboardapp sending its own email via SMTP. A recent review of the Windows event logs also found Power Automate flows and older server-side scripts in the mix. No one has the full list on screen. - Alerting is click-ops. The action-group names (
Test,Migration,Recommended) are the fingerprints of alerts created by hand in the portal, one incident at a time, and never cleaned up. There is no source of truth in version control. - Collected data is not acted on — in two ways. First, a recent review of the Windows event logs found a large volume of events ingested with no alert rule firing on them: a cleared audit log, an account lockout, an app-pool crash, or an ADFS certificate expiry all pass unnoticed. Second, Application Insights does capture exceptions and failures extensively — but with so much noise (many legitimate exceptions and expected non-200 responses that are not real problems) that the genuine issues are effectively impossible to find. The gap is not coverage; it is signal-to-noise.
- Fachtest has no alerting despite being an important environment for partner-company developers. It is not unmonitored — its apps ship telemetry to Application Insights like everywhere else — but a partner-blocking failure there pages no one.
- There are no dashboards. Infrastructure metrics (CPU, memory, disk) arrive via Arc/VM Insights but there is no unified place to see them; diagnosis means hunting per resource in the portal.
- There is no health standard. No application declares what "healthy" means for itself in a consistent, machine-checkable way.
Impact
- Missed incidents. Signals that should page a human are either not wired at all (Fachtest, event data) or buried among non-actionable noise.
- Slow diagnosis. Without dashboards and a correlation story, every investigation starts from scratch.
- Unowned sprawl. Alerts fire from scripts and flows nobody maintains; alerts that should exist don't.
- No template for new work. A developer shipping a new service has no pattern to follow, so the sprawl compounds.
- Compliance drag. DORA expects documented, managed ICT monitoring. Click-ops islands are hard to evidence; see audit-log-strategy.md.
Goals
- A single classification rule every developer applies to decide alert-vs-dashboard, backed by an explicit rationale.
- A shared severity model with defined (best-effort) response expectations.
- One notification layer — a small, named, version-controlled set of action groups — replacing the current 11-plus ad-hoc paths.
- One visualization layer for dashboards (tool decision framed below).
- An application health standard that each team implements for its own service, with a strategy that keeps health-check traffic from becoming noise.
- A consolidation path that inventories every existing island, re-homes it into the model, and retires it.
- Alerts and dashboards defined as code, so they stop being untracked click-ops artifacts.
- SLOs defined per service, tying user-centric targets to symptom-based alerting.
- Fachtest brought under proportionate monitoring (partner-impacting alerts present; low-severity noise suppressed).
Non-Goals (explicitly out of scope):
- Rebuilding the data-collection layer (Application Insights, Serilog/Fluent Bit, AMA/DCR) — it stays as documented in monitoring-logging.md.
- The audit / compliance logging programme — covered by audit-log-strategy.md. This document references it but does not duplicate it.
- Introducing a formal 24/7 on-call rotation or customer-facing availability SLA. Response stays best-effort for now; the model leaves a clean upgrade path.
- Replacing Application Insights as the APM. It is working and stays.
Foundational Principles (MUST)
The concept rests on a small number of ideas that are well established in the operations and SRE field. Stating the reasoning explicitly is what lets every team apply the model consistently without re-deciding it each time. The rules this proposal asks to adopt are marked with keywords; the surrounding text is the reasoning behind them, not part of the rule.
1. Three signal types, two purposes
Observability data comes in three types — metrics (numeric time series), logs (discrete events), and traces (causally-linked spans). The platform already collects all three. The important distinction for this concept is not the type of signal but its purpose:
- Alerting — a signal whose job is to page a human because something needs action now.
- Diagnostics / dashboards — a signal whose job is to explain what is happening once you are already looking.
The same raw metric can serve both purposes, but the two purposes have opposite design goals. An alert must be rare, trustworthy, and actionable. A dashboard must be rich, detailed, and complete. Conflating them is the root cause of both alert fatigue and blind spots.
2. The four golden signals — and why they are the standard
The industry-standard starting point for "what should I measure on a user-facing service" is the four golden signals, popularised by Google's Site Reliability Engineering practice (SRE Book, Monitoring Distributed Systems):
| Signal | Question it answers | Typical measure |
|---|---|---|
| Latency | How long do requests take? | p50 / p95 / p99 response time, split success vs error |
| Traffic | How much demand is there? | requests/sec, sessions, throughput |
| Errors | How often do requests fail? | error rate, exception rate, failed dependencies |
| Saturation | How full is the system? | CPU, memory, disk, thread-pool, queue depth |
Why this set, and why it is treated as a standard rather than one opinion among many:
- It is small enough to be universal. Almost any request/response service — an ASP.NET API, a reverse proxy, a database — can be described by these four. That means one mental model, one dashboard shape, and one alerting posture across the whole platform, instead of a different bespoke set of graphs per service.
- It separates what users feel from why. Latency and errors are what a user experiences. Traffic and saturation are largely explanations for changes in the first two. This maps directly onto the alert-vs-dashboard split (principle 3).
- It scales down. A team that does nothing else but instrument these four already has a defensible monitoring baseline. It is the floor every service is asked to reach, and the template the dashboards start from.
Every service MUST instrument the four golden signals: this concept adopts them as the default instrumentation contract.
3. Alert on symptoms, not on causes (MUST)
This is the most important rule in the concept: a human MUST only be paged for a symptom, and a cause MUST NOT page on its own. A well-known formulation comes from Rob Ewaschuk's My Philosophy on Alerting:
Page a human only when a symptom is user-visible or imminently will be. Everything else is a cause — put it on a dashboard.
A symptom is a degradation someone actually feels: requests are slow, requests are failing, the site is down, a batch missed its deadline. A cause is a mechanism that might lead to a symptom: CPU is high, a disk is filling, a queue is growing, a dependency is slow.
Why alert on symptoms rather than on causes / raw metrics:
- There are few symptoms and many causes. "The API is returning errors" is one alert. The dozens of things that could cause it (CPU, memory, GC pauses, a bad deploy, a slow query, a downstream outage) are dashboard material. Alerting on every cause produces a flood; alerting on the symptom produces one actionable page.
- Most cause-excursions are harmless. CPU hits 95% during a nightly job and nobody is affected. A disk crosses 80% and self-corrects at the next cleanup. If those page a human, the human quickly learns to ignore pages — and then misses the one that mattered. Alert fatigue is a genuine reliability risk, not just an annoyance.
- Symptoms are stable; causes churn. The set of ways a service can feel broken to a user barely changes. The set of internal mechanisms changes with every refactor and capacity change. Symptom-based alerts need far less maintenance.
- Every page must demand intelligent human action. If an alert fires and the right response is "watch it" or "it recovered on its own," it MUST NOT have been an alert. That test is much easier to pass for symptoms than for raw metric thresholds.
Why alert fatigue is structural — not something discipline can fix. It is tempting to believe the answer to too many alerts is willpower: just ask everyone to read every alert carefully. That does not work, and understanding why is the reason this concept exists at all. When most alerts are non-actionable, anyone — including the most conscientious engineer — learns, correctly and from repeated experience, that a fresh alert is probably nothing, and starts skimming, muting, or deferring. The one alert in fifty that actually mattered then lands in an inbox already trained to ignore it. That missed alert is the blind spot, and it is a direct, predictable consequence of the noise — not a lapse of attention a reminder could prevent. Humans are inherently poor at sustaining vigilance against a signal that is almost always false, and good intentions do not change that. So the noise cannot be disciplined away; it has to be designed away. The only durable remedy is to make alerts rare and trustworthy, so that "an alert fired" reliably means "act now" — and every non-actionable alert removed protects the credibility of the ones that remain. That is precisely why symptoms, not causes, decide what pages.
Causes are not thrown away — they are demoted to dashboards. When a symptom alert fires, the on-call person opens the golden-signal dashboard and the saturation/cause panels tell them why. Saturation metrics (CPU, memory, disk) are the classic example: essential for diagnosis, poor as alert triggers on their own.
The "it causes both" case is handled naturally. Take a concrete example: high CPU that lengthens response times. High CPU is a cause — it lives on the dashboard. Prolonged response time is a symptom — it triggers the alert. When the alert fires, the CPU panel on the dashboard explains it. There MUST NOT be a separate "high CPU" alert; if high CPU ever occurs without a user-visible symptom, no human action is required, so no page is warranted. The saturation panel and, later, capacity trending catch the slow-burn case.
The one sanctioned exception: predictive/imminent alerts. A cause MAY be alerted on when it reliably and imminently leads to an unavoidable symptom and there is a window to act — e.g. "disk will be full in 4 hours at the current rate," or "TLS certificate expires in 14 days." These are few, MUST be genuinely predictive (not a static threshold that flaps), and MUST still be actionable.
4. Keep database queries on-premises (MUST)
A sound principle — and the original rationale for the on-premises monitoring app — is that no cloud resource may query the on-premises database directly. It is worth keeping, but worth stating precisely, because the premise shifted when the servers were onboarded to Azure Arc.
What Arc actually changed. Onboarding to Arc did create "a connection between the DB servers and Azure," but its shape matters: the Arc agent makes outbound, agent-initiated, TLS connections and pushes data out. Azure gains no inbound network route to port 1433 — no cloud resource, and no cloud dashboard tool, can open a socket to the database merely because Arc exists. What Arc does add is a control-plane path: someone with sufficient Azure RBAC (or an Azure-side compromise) can use Arc's run-command / extension capability to execute code on the server, which could then reach the DB locally. The trust boundary thus moved from "network isolation" to "Azure RBAC and agent governance."
Assessment. This is an acceptable, standard arrangement. Arc's outbound-only model is the Microsoft-recommended pattern for exactly this situation. The residual control-plane risk is real but manageable — least-privilege RBAC on the Arc resources, restricting who may run commands or deploy extensions, Defender for Servers, and auditing the agent (the direction audit-log-strategy.md already takes). The platform has already accepted this channel by onboarding to Arc, so reusing it to ship monitoring data outward adds no new trust boundary.
The principle, stated precisely as two points (rather than one absolute):
- An inbound network path to the database MUST NOT be opened for a cloud tool — no VPN/Private Link/tunnel just so a PaaS service (e.g. Azure Managed Grafana) can run
SELECTs against on-prem SQL. That would be a genuine new exposure, and Arc neither provides nor requires it. - Push SHOULD be preferred over pull, and query execution MUST stay on-prem. Anything that runs a query inside the network MUST be evaluated on-premises and publish only its result outward, over the already-trusted channel. Outbound telemetry and verdicts are fine.
This precise version shapes the health-probing decision and the future of the on-premises monitoring app below.
Target Architecture
The concept is a set of planes layered on the existing collection plane. Data flows up; a push boundary separates on-prem evaluation from cloud observation.
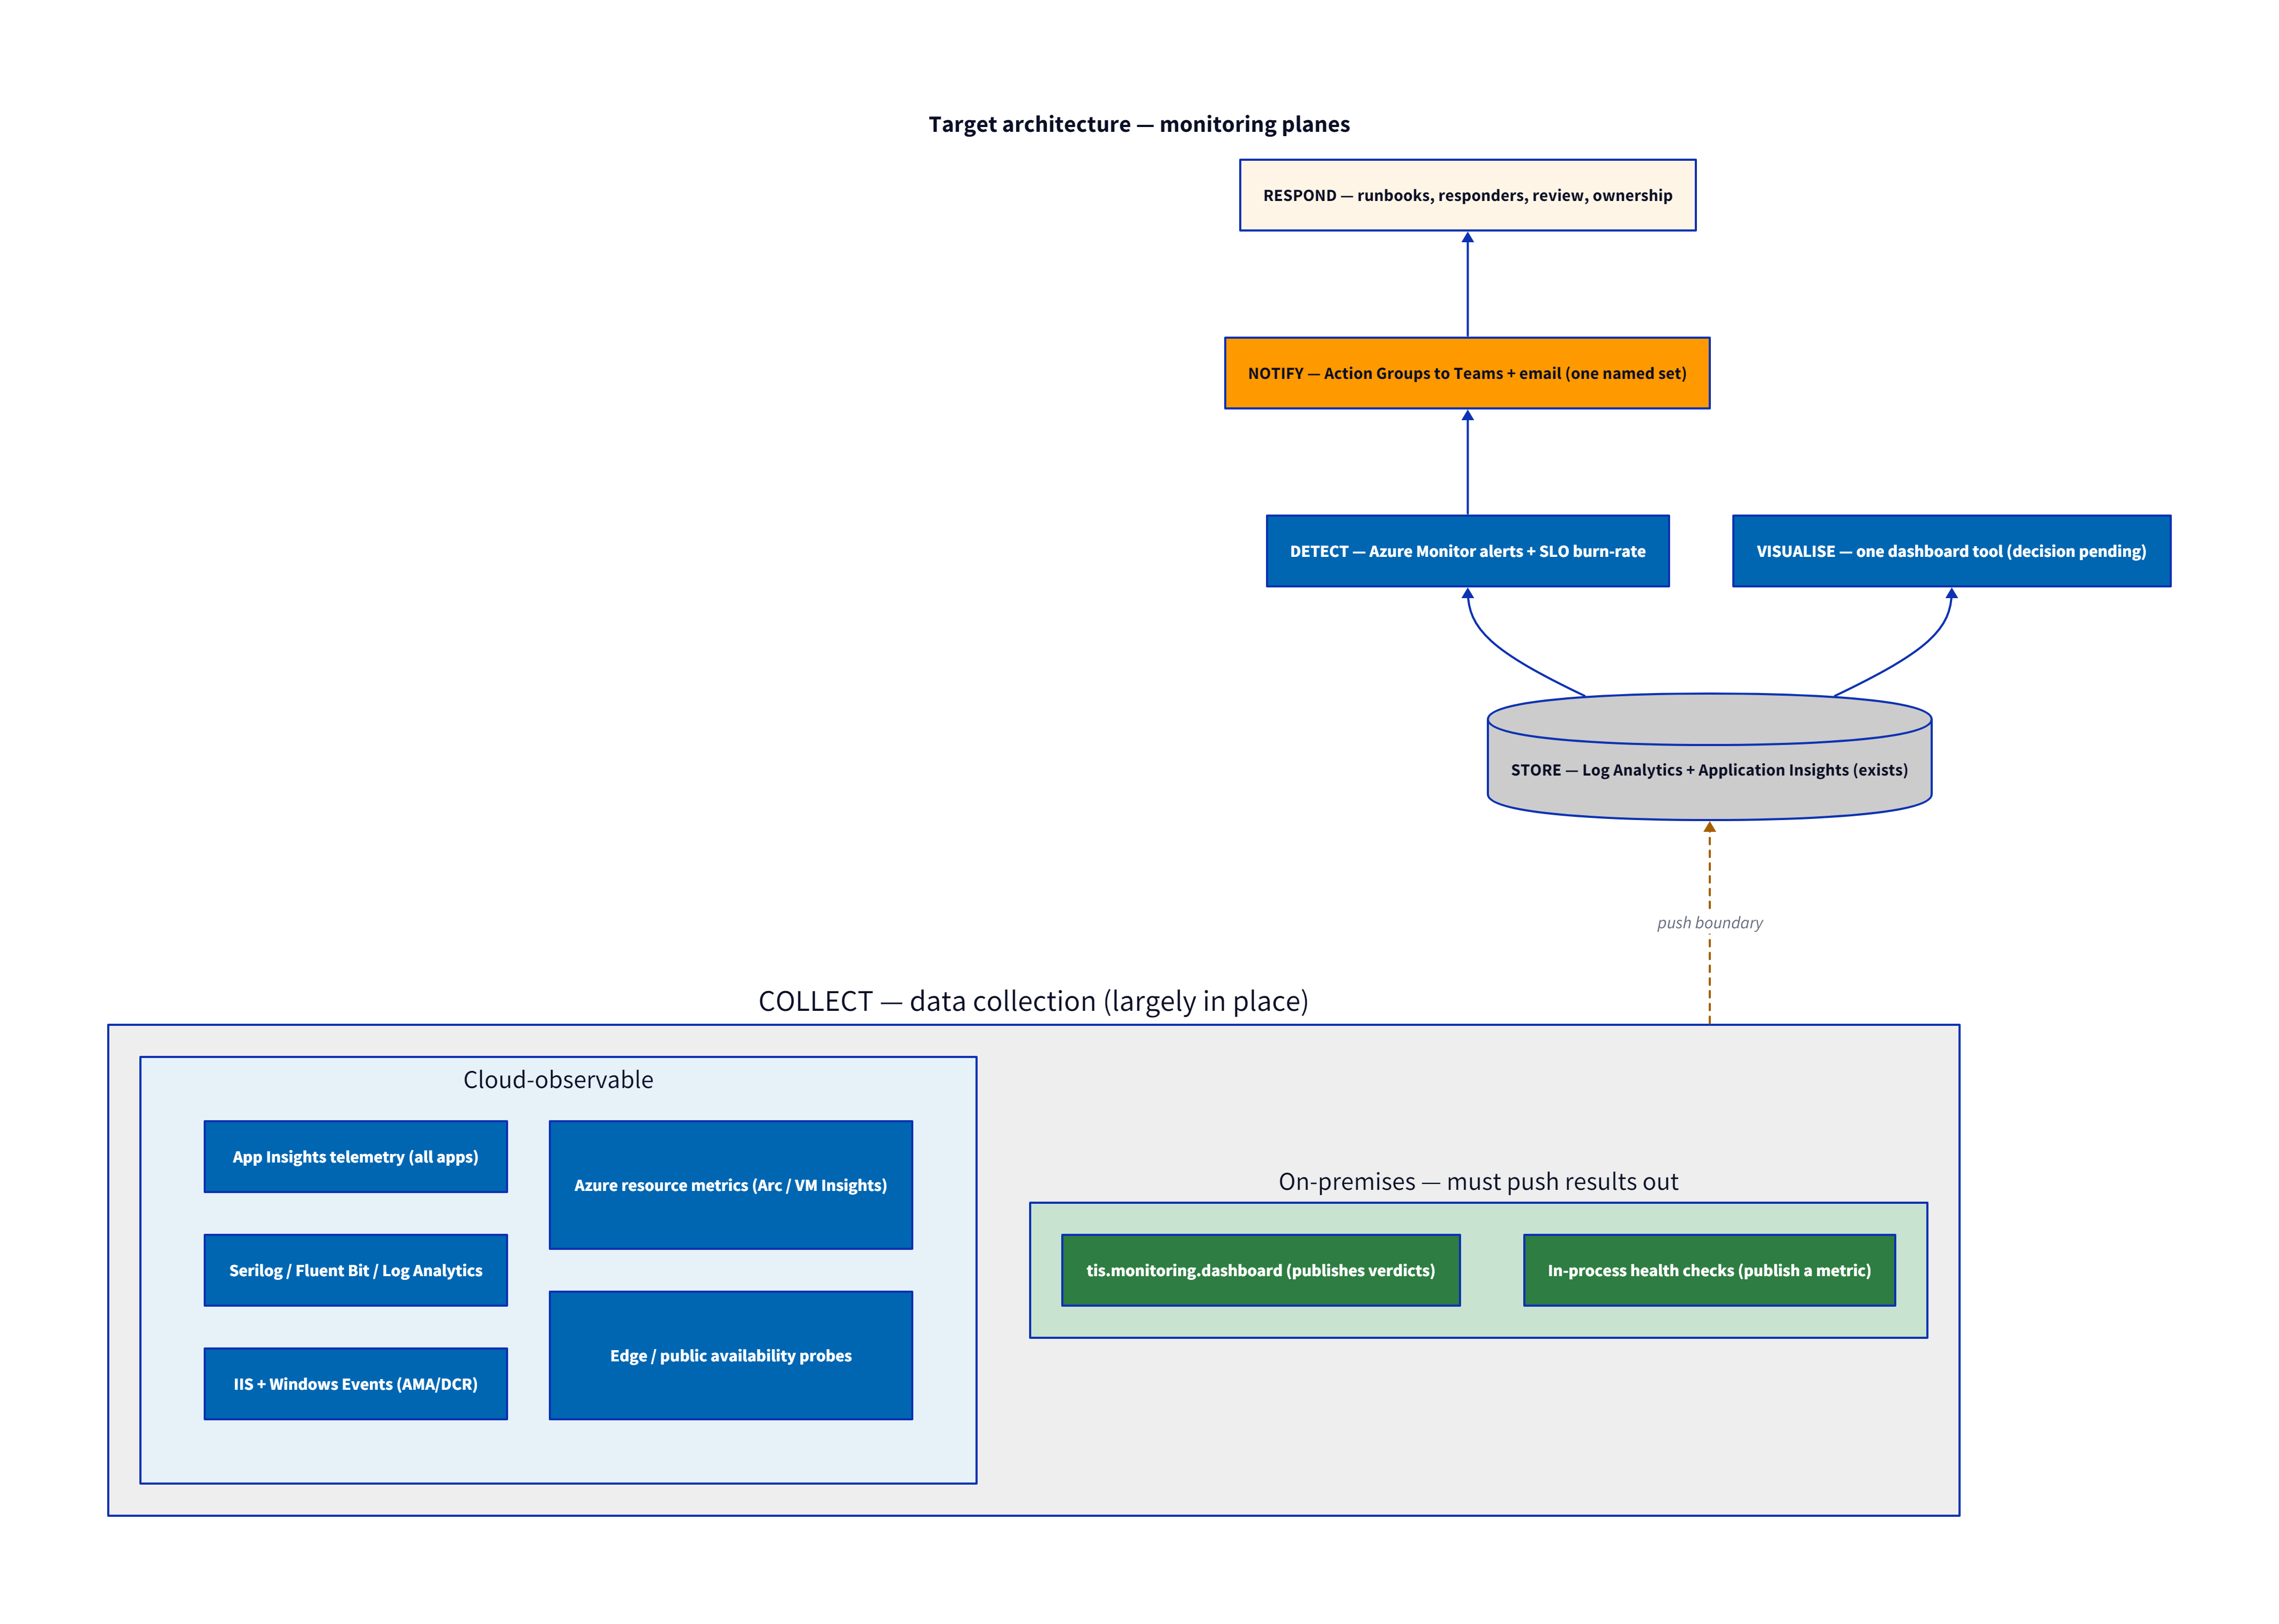
Reading the diagram: everything below the push boundary is collection, already largely in place. Everything above is what this concept adds or consolidates. The most important structural change is that all notification converges on one action-group layer instead of the current many paths, and all dashboards converge on one tool.
Application Health Model
Each service must declare, in code, what "healthy" means for itself — and expose that declaration in a standard way. This is the concrete form of the "every developer defines healthy" idea.
The health contract
We standardise on ASP.NET Core Health Checks, plumbed centrally through Tis.Hosting.Extensions (the same place Application Insights and Serilog are already centralised), so a team gets the wiring for free and only writes the checks specific to their service. Three endpoints, three audiences:
| Endpoint | Audience | Runs | Purpose |
|---|---|---|---|
/health/live | Load balancer / IIS / orchestrator | No dependency checks — process-responsive only | "Is the process alive?" — safe to probe frequently |
/health/ready | Deployment / traffic gating | Dependency checks (DB, downstream APIs, disk) | "Can it serve traffic right now?" |
/health | Humans / central plane | Full, detailed per-check report | Diagnosis and the published health signal |
Each team registers dependency checks and declares each one's criticality:
- Unhealthy — the service cannot do its job (e.g. its primary database is unreachable). Fails readiness.
- Degraded — the service works but something is impaired (e.g. an optional cache is down, a non-critical downstream is slow). Readiness still passes; the degradation is visible on the dashboard and may be a low-severity signal.
This is where a developer's own judgement about their application lives — and because it is expressed in standard check registrations, it is uniform across every service.
Managing health-check noise (the real concern)
A common and reasonable objection to health endpoints is noise — frequent probes flooding telemetry, logs, and the database. This is a solved problem if the design separates probing frequency from check execution from telemetry volume. Five rules:
- Keep liveness trivial.
/health/liveruns no dependency checks — it returns 200 if the request pipeline is responsive. The high-frequency probe (load balancer, every few seconds) therefore costs almost nothing and never touches the database. - Evaluate on a timer, not per probe. Use a
HealthCheckPublisher, which runs the (expensive) checks in-process on a fixed interval (e.g. every 30 s) regardless of how often anyone probes. The published result is the source of truth for the central plane. Inbound probe rate no longer drives check execution. - Cache dependency-check results. Wrap expensive checks so a burst of readiness probes returns a cached verdict (short TTL) instead of hammering the database N times. Combined with rule 2, dependency load from health checking becomes a fixed, low, predictable rate.
- Filter health traffic out of telemetry. Add an Application Insights
ITelemetryProcessorthat drops request telemetry for/health*, and a Serilog request-logging filter that excludes those paths (and optionally exclude them from IIS W3C logs). Health probing then contributes nothing to request counts, dashboards, cost, or log volume. - Publish one signal, not a stream. The
HealthCheckPublisheremits a single health datapoint per interval to the central plane (a custom metric and/or an availability result). That one signal is what dashboards and alerts consume — decoupled entirely from probe frequency.
With these five rules, the noise concern is fully addressed: the noisy part (frequent probing) is cheap and filtered, and the meaningful part (dependency evaluation) runs at a controlled cadence and produces exactly one clean signal.
Who probes / evaluates health?
There are three candidate mechanisms; they are complementary, not exclusive.
| Mechanism | Pros | Cons | Best for |
|---|---|---|---|
App Insights availability tests (standard URL test / TrackAvailability) | Native, no infra, multi-region, built-in alerting, integrates with the golden-signal story | Can only reach endpoints exposed to Azure; cannot run DB-internal checks (and must not); URL-ping style is being retired in favour of standard tests; per-test cost | Externally reachable symptom checks (is the edge/API up from the outside?) |
| On-prem evaluator that publishes (the monitoring app, or an in-process publisher) | Keeps query execution on-prem; can run deep internal checks; already partly exists | Something must run and be maintained on-prem; single-instance concerns | DB-dependent and internal-only checks |
| A new dedicated prober | Fully tailored | Yet another component to build, run, and own; duplicates the two above | Rarely justified |
Recommendation: a hybrid. Use App Insights availability tests for what is legitimately observable from the cloud (edge/API reachability and latency — a genuine symptom signal). Use on-prem evaluation that pushes results outward for everything that needs the database or internal network. Do not build a new prober. This keeps the push boundary intact and reuses what exists.
The Role of tis.monitoring.dashboard
This app was originally built because cloud services cannot query the on-premises database directly (principle 4). With that reasoning stated precisely, its future is an open question — and much of it may now be redundant. The deciding factor is where query execution has to happen, which depends on the visualization-tool choice.
What it is today. An ASP.NET Core (.NET 8) app with an Angular UI and in-process Hangfire jobs. Every few minutes it runs read-only SQL/DMV and Kusto queries and computes a Healthy/Warning/Unhealthy verdict per item. It emails on two alert jobs, surfaces results in its own UI/REST endpoints, emits its own app telemetry to Application Insights — but does not publish its verdicts outward.
Its checks are not all equal — split them by where they can run:
| Check type (examples) | Needs on-prem SQL? | Where it can live |
|---|---|---|
| OMDS Explorer exceptions, SOAGFX anomaly (App Insights/Kusto), App Gateway UnhealthyHostCount (Azure Monitor) | No — already cloud-observable | Azure Monitor alerts plus any Grafana/Workbook today; no on-prem component |
| Head-blocks, index fragmentation, per-insurer deliveries, SQL memory, long-running queries, Uniqa-EOP, Allianz sync | Yes — read-only DMV/business-table queries | On-prem query execution required (see options) |
A meaningful fraction of the app therefore duplicates signals the cloud plane already sees; those should move out regardless of the app's fate.
Options for the DB-dependent checks:
| Option | How | Trade-off |
|---|---|---|
| A — Self-hosted (on-prem) Grafana with a read-only MSSQL data source | Grafana runs the SQL checks on a schedule, visualizes them, and alerts — the bespoke app largely disappears | Only works if Grafana is on-prem (it needs line-of-sight to 1433); most of the app retires; keep only logic Grafana cannot express (the KQL anomaly query, regex SMR5 classification) |
| B — Slim on-prem publisher | A much smaller on-prem job (a trimmed app, or a scheduled script / SQL Agent job) runs the DMV queries and pushes verdicts to Log Analytics/App Insights; any Grafana or Workbook then reads them | Needed if you pick Azure Managed Grafana or Workbooks, since neither can query on-prem SQL directly (principle 4). A small component, not the full app |
| C — Status quo | Leave the app as-is | Rejected — an unowned island with its own private email path |
Recommendation / lean — this rides on the visualization choice:
- If you go self-hosted Grafana, take Option A: it is the cleanest way to retire most of
tis.monitoring.dashboard, and it is the single strongest argument for self-hosting. - If you go Managed Grafana or Workbooks, take Option B: a slim publisher, not the full app.
- Either way: move the cloud-observable checks out now. A full custom ASP.NET + Angular app with its own SMTP alert path is more than this role needs.
Classification and Severity in Practice
How a developer decides: alert or dashboard?
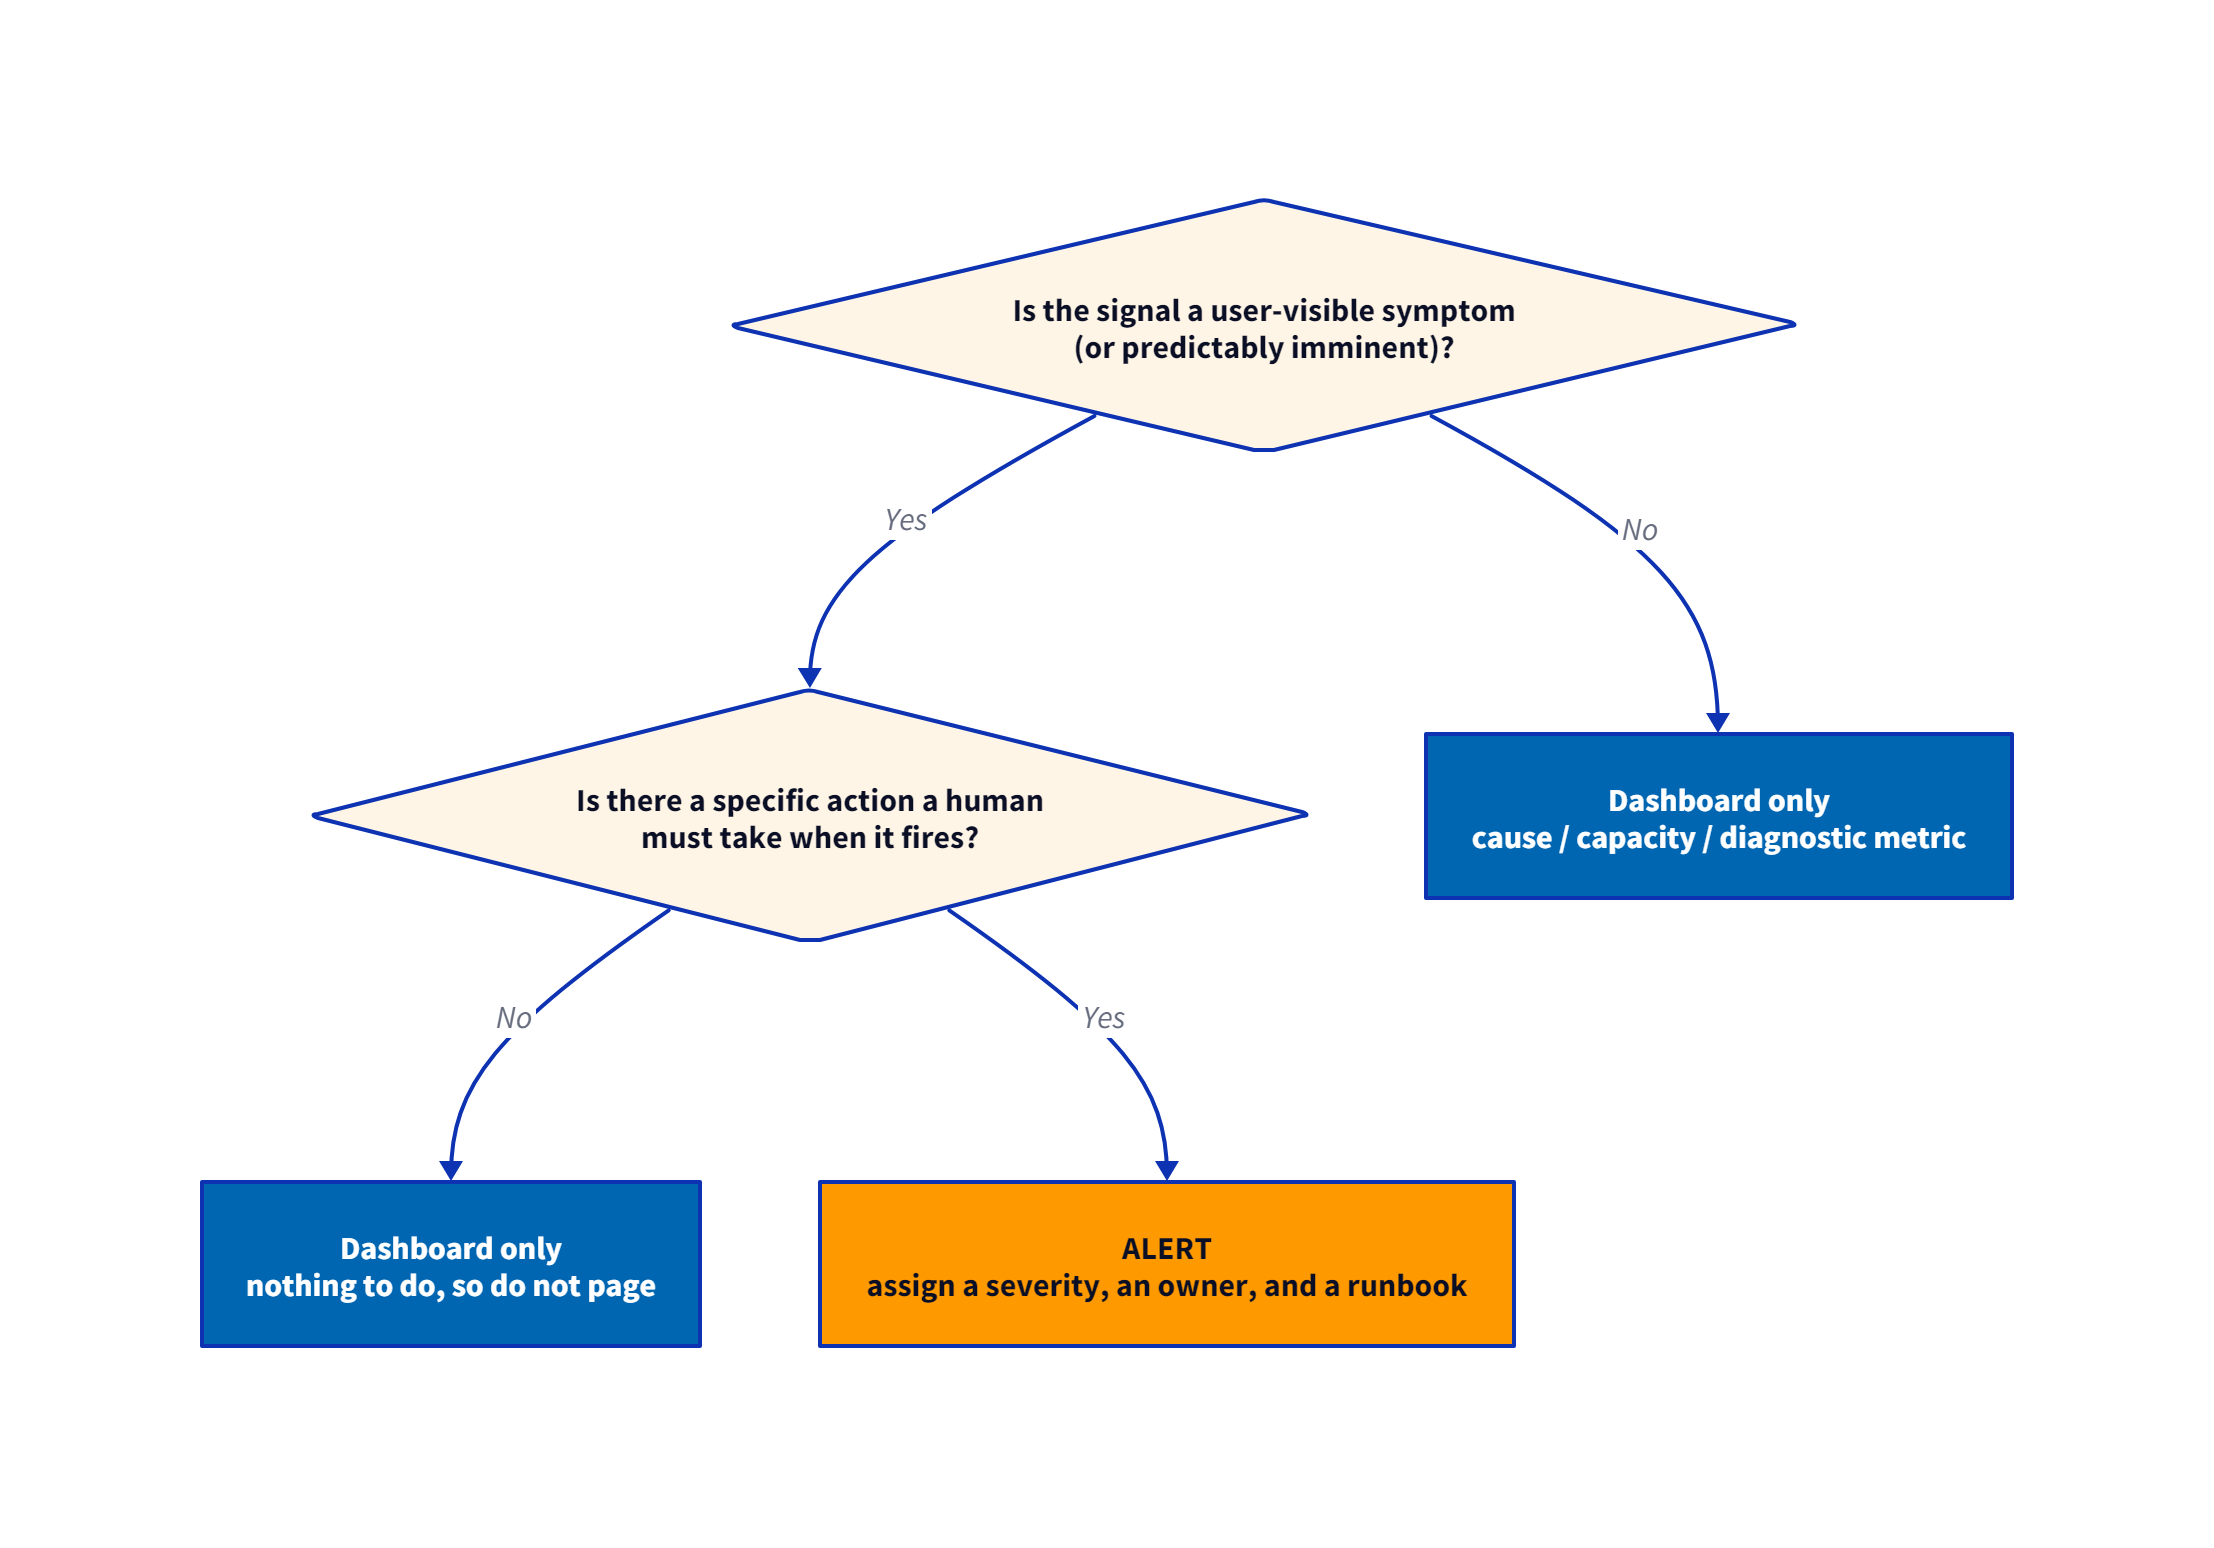
If a proposed alert cannot name the human action it demands, it is not an alert. If a metric is useful only after you are already investigating, it is a dashboard panel.
Severity model
There is no formal severity model today; this is the proposed one. Two axes are kept separate on purpose: severity (how bad) and delivery (how the signal reaches people). Delivery has three modes — Push (interrupts a human via a Teams channel — Prod-Probleme for Sev1, Monitoring - PROD for Sev2 — and/or email), Digest (a once-daily aggregated summary, never per-event, posted to Together-Standup), and Dashboard (pull; look when you choose). Response targets are best-effort — no guaranteed on-call today and none promised to customers; they express intent and priority, not an SLA.
| Severity | Meaning | Example | Response target (best-effort) | Delivery |
|---|---|---|---|---|
| Sev1 — Critical | Customer-facing outage or severe degradation; or a security/data-integrity emergency | Portal down; API error rate spiking; auth broken | Immediate — best-effort, any hour | Push — Teams (Prod-Probleme) + email |
| Sev2 — High | Partial or degraded service; single component; workaround exists; or imminent Sev1 | One cluster unhealthy; sustained elevated latency; disk full in hours | Same working day, prioritised | Push — Teams (Monitoring - PROD) + email |
| Sev3 — Medium | Limited/no customer impact yet; needs attention; recurring errors or trends | Elevated background exceptions; a degraded optional dependency | Next working day; discussed at the daily standup | Digest — daily morning summary in Teams (Together-Standup), plus the dashboard; auto-escalates to Sev2 if it worsens |
| Sev4 — Low / Info | Informational, hygiene, non-urgent | Cosmetic warnings; low-priority housekeeping | Backlog | Dashboard only |
Routing matrix (severity × environment)
Prod carries the full model. Fachtest is proportionate: it has no external customers, so it only pushes for a partner-blocking Sev1; everything below rolls into the digest or the dashboard, keeping the interrupt channels quiet.
| Environment | Sev1 | Sev2 | Sev3 | Sev4 |
|---|---|---|---|---|
| Together-Prod | Push (Prod-Probleme + email) | Push (Monitoring - PROD + email) | Daily digest + dashboard | Dashboard only |
| Together-Fachtest | Push (Teams + email) | Daily digest + dashboard | Dashboard only | Dashboard only |
The Sev3 daily digest
Sev3 signals are aggregated into one Teams message per morning (working days), posted to the Together-Standup channel — never per-event. Each digest covers the previous day; the Monday digest covers Friday through Sunday. It is a rollup (for example: "eSign API — 210 dependency exceptions, up versus the 7-day average; index-fragmentation warning on one database"), not a stream.
- It is walked at the daily standup. That is the review ritual that makes the digest work — items get discussed, assigned, or closed there, so nothing rots on a dashboard nobody opens.
- Each Sev3 auto-escalates. A Sev3 carries a threshold that promotes it to a Sev2 push if it crosses into customer impact or persists (e.g. rate exceeds the impact line, or it is still present after N days). The interrupt happens when it starts to matter — not before.
- Mechanism: a small scheduled job (e.g. a Logic App or scheduled query) runs a KQL summary and posts to the channel via a Teams webhook on working-day mornings, with a 72-hour window on Mondays. Defined as code like everything else.
Alert quality rules (non-negotiable)
- Actionable — names the human action; if none, it is a dashboard.
- Symptom- or SLO-based — raw-cause alerts require the predictive-exception justification.
- Runbook link — every alert's description links a short runbook (what it means, first checks, escalation). Where draft alerts already carry a one-line context string in their
--description, this becomes standard practice. - Owned — every alert has a named owning team.
- Not flappy — appropriate window/aggregation; alerts that flap get tuned or deleted, not muted-and-forgotten.
- Defined as code — see the IaC section.
Service Level Objectives
Defining SLOs is part of this work (there are none today). An SLO turns the golden signals into user-centric targets and gives symptom-based alerting a principled trigger.
- An SLI (indicator) is a measurement of the service from the user's perspective — almost always drawn from the latency and errors golden signals (e.g. "proportion of requests served successfully in under N ms").
- An SLO (objective) is a target for that SLI over a window — e.g. "99.5% of portal requests succeed within 800 ms over a rolling 28 days."
- The error budget is the allowed shortfall (100% − SLO). It makes "how much unreliability is acceptable" explicit and shared.
Why this belongs in the concept: the mature form of symptom-based alerting is error-budget burn-rate alerting — page when the service is consuming its error budget fast enough to breach the SLO, not when a raw metric crosses a static line. This is inherently user-centric and naturally rare. The concept adopts SLOs as the long-term basis for Sev1/Sev2 application alerts (Google SRE Workbook, Alerting on SLOs).
Pragmatic rollout: each team proposes a small starter set (one availability SLO, one latency SLO) for its service as part of its health contract. Start with simple threshold alerts on the SLIs; graduate to multi-window burn-rate alerts as the dashboards prove the numbers. SLOs are internal targets, consistent with the best-effort posture — not customer commitments.
Notification and Action Groups
Consolidate the current 11-plus action groups and side-channels into a small, named, version-controlled set. Proposed shape:
| Action group | Channel(s) | Consumers |
|---|---|---|
ag-prod-critical | Teams (Prod-Probleme) + email | Prod Sev1 |
ag-prod-standard | Teams (Monitoring - PROD) + email | Prod Sev2 |
ag-fachtest-standard | Teams + email | Fachtest Sev1 |
- Action groups exist only for the push severities. Sev3 and below have no action group — they are delivered by the Sev3 daily digest (a scheduled job posting to the Together-Standup channel) plus the dashboards. This keeps the interrupt path small and trustworthy.
- Teams integration via a Workflows/webhook receiver; email via the action group's email receiver. This covers today's need ("Teams + email is good enough").
- Naming convention:
ag-{env}-{tier}. No moreTest/Migration/Recommendednames in production. - Upgrade path: if the business later decides to guarantee response, add SMS/push receivers or plug an on-call tool (Grafana OnCall, Opsgenie, PagerDuty) into
ag-prod-critical— no alert rules change, only the receiver behind the group.
Consolidating the Existing Islands
Discovery is an explicit work item — several alerting mechanisms are running that nobody currently tracks.
Discovery snapshot (2026-07-20)
The Azure-side starting point (read-only inventory):
| Subscription | Metric alerts | Log alerts | Activity-log alerts | Action groups |
|---|---|---|---|---|
Together-Prod (1c60fabf-…) | 15 | 15 | 0 | 11 |
Together-Fachtest (87fbfaf0-…) | 0 | 0 | 0 | 1 (auto) |
Beyond Azure-native alerts, at least these paths are known or suspected: a Logic App (ActionGroup-LogicApp), a Teams-channel action group (Info Team Kanal), Power Automate flows, old server-side scripts / scheduled tasks that email, App Insights Smart Detection, and the tis.monitoring.dashboard SMTP alerts.
Inventory method
Automate the Azure side; do the rest assisted/manual.
# Azure-native alerting inventory, per subscription
for SUB in 1c60fabf-272f-4ece-8b91-cf1596406d30 87fbfaf0-9e66-41e0-a265-6667e057d8a3; do
  echo "=== $SUB ==="
  az monitor metrics alert list      --subscription "$SUB" -o table
  az monitor scheduled-query list     --subscription "$SUB" -o table
  az monitor activity-log alert list  --subscription "$SUB" -o table
  az monitor action-group list        --subscription "$SUB" \
    --query "[].{name:name, rg:resourceGroup, email:length(emailReceivers), webhook:length(webhookReceivers)}" -o table
done
- Logic Apps — enumerate with
az logic workflow listper subscription; inspect any that send mail/Teams. - Power Automate — enumerate in the Power Platform admin centre (not visible to
az); requires a tenant admin. - Server-side scripts / scheduled tasks — inventory Task Scheduler and startup scripts on the servers already onboarded via Arc (Arc Run Command can query them fleet-wide).
tis.monitoring.dashboard— itsAlertstable lists every email alert it owns.
Catalogue → classify → re-home → retire
For each discovered mechanism, record: what it watches, how it notifies, who owns it, and its disposition (keep-as-is / migrate / retire). Then migrate keepers into the model — classified by taxonomy and severity, routed through the standard action groups, defined as code — and retire the island once its replacement is verified.
First consumers (pilot the model on work already scoped):
- A set of draft alerts from a recent Windows event-log review (cleared audit log, account lockout, app-pool crash, ADFS certificate expiry, failed-logon spikes, heartbeat loss) — implement these as the first code-defined alerts in
ag-prod-*. - A related, in-flight logon-monitoring proposal — proceeds on its own track but adopts this concept's classification, severity, and action-group conventions rather than inventing new ones.
Infrastructure as Code
Recommendation: define action groups, alert rules, DCRs, and dashboards as code, reviewed via pull request, deployed by pipeline. Proposed default tool: Bicep (Azure-native, no state files to manage, first-class support for Microsoft.Insights resources, natural fit for a Microsoft-centric shop). Terraform is a reasonable alternative if the platform team already standardises on it or wants one tool across providers; Grafana dashboards can likewise be version-controlled as JSON and provisioned, or managed via the Terraform Grafana provider.
Why this matters — it is the fix for the root cause, not a nicety:
- Click-ops is literally how the islands formed. The
Test/Migration/Recommendedaction groups exist because alerts were hand-built in the portal and never tracked. Code in git makes every alert discoverable, reviewable, and owned — directly ending "nobody has it on screen." - Prod/Fachtest parity by parameter. The same definition deploys to both environments with different parameters (Prod full, Fachtest proportionate). No more "Fachtest has zero alerts because nobody re-clicked them there."
- No drift. Portal changes are detected and reconciled; the deployed state matches the reviewed state.
- Disaster recovery. The entire alerting/dashboard estate can be recreated from source.
- Auditable change management. Every change is a reviewed, versioned commit — exactly the evidence DORA expects for ICT change and monitoring controls (ties to audit-log-strategy.md).
- Review spreads knowledge. A PR is where a second person learns the alert exists — the antidote to unowned sprawl.
Visualization / Dashboards — decision pending
A single dashboarding tool is a goal; the choice is deliberately left open here with the trade-offs laid out, since it needs a platform/cost decision. All three options read the data that already exists (Azure Monitor metrics, Log Analytics, Application Insights).
| Option | Pros | Cons | Cost shape |
|---|---|---|---|
| Azure Managed Grafana (PaaS) | Best single-pane across Azure Monitor + Log Analytics + App Insights + Arc/Prometheus; rich, familiar Grafana UX; can also own alerting later; dashboards-as-code | Additional managed service to run and govern; another access-control surface; monthly service cost; cannot query on-prem SQL directly (DB checks need an on-prem publisher — principle 4) | ≈ $60 / month per instance plus ~$6 per active user / month — billed per subscription, so both are doubled across the separate Prod + Fachtest subscriptions |
| Self-hosted Grafana (on a VM) | Full control; no PaaS dependency; same Grafana UX and plugin ecosystem; queries both Azure Monitor / Log Analytics (KQL) and on-prem SQL directly (read-only MSSQL data source) — one pane over the whole estate, and the only option that can absorb tis.monitoring.dashboard's DB checks; no per-user licence | You patch, secure, back up, and keep it available; an extra server to own | VM + operational effort |
| Azure Workbooks + Azure Dashboards (native) | No extra service or cost; tightest Azure integration; excellent for KQL-heavy views; shareable in-portal | Less polished for mixed real-time/operational dashboards; weaker cross-source UX than Grafana; per-user portal experience | Included (query cost only) |
Lean (not a final decision): Managed Grafana is the weakest on cost — it runs ≈ $60/month per instance plus ~$6 per active user / month, billed per subscription, so both are paid twice across the separate Prod and Fachtest subscriptions, which is hard to justify here. That leaves two attractive shapes: self-hosted Grafana for the best UX and a genuine single pane over the whole estate (Azure Monitor/Log Analytics via KQL and on-prem SQL) with no per-user cost, if the team will own a VM; or Azure Workbooks + Dashboards for a zero-licence, Azure-native option where KQL-centric views suffice. Both keep alerting in Azure Monitor for now; only pick Grafana-owned alerting if the team consciously wants it. A short spike building the same golden-signal dashboard in each would settle it quickly.
Dashboards as code, owned by each app. Whichever tool wins, dashboard definitions belong in version control — and ideally in each application's own repository, deployed by its pipeline, so a team owns its dashboards the same way it owns its alerts and health contract. Grafana dashboards are JSON provisioned via the Terraform Grafana provider, the HTTP API, or file/Git provisioning (identical for managed and self-hosted). Azure Workbooks and Azure Dashboards are ARM resources (Microsoft.Insights/workbooks, Microsoft.Portal/dashboards) whose JSON deploys via Bicep, fitting the IaC-tool decision directly. Grafana gives the smoother authoring-and-as-code loop; Workbooks give the tightest native/Bicep fit. Two clarifications that matter for the choice: Grafana speaks KQL (its Azure Monitor data source queries Log Analytics and App Insights, not just metrics), and self-hosted Grafana can query Azure Monitor and the on-prem DB at once — so "KQL-heavy" and "single pane" are not Workbooks- or PaaS-only strengths.
Operating Model and Governance
- Ownership split. A platform/operations owner owns the shared planes (workspaces, the standard action groups, the dashboard tool, the standards themselves and the
Tis.Hosting.Extensionshealth plumbing). Each dev team owns its service's health contract, SLOs, dashboards, and alert rules — authored as code and reviewed. - Responder reality. Best-effort; some people are reachable off-hours but nothing is guaranteed. The severity model and routing are designed to work under that reality and to upgrade cleanly if it changes.
- Runbooks. Every alert links a short runbook; an alert for which no runbook can be written is a sign it should be a dashboard metric, not an alert. There are none today — they are introduced and explained just below.
- Review cadence. The Sev3 daily digest is walked at the daily standup — where its items get triaged, assigned, or closed. Separately, review the whole alert set periodically (e.g. monthly): prune the flappy, the never-fired, and the non-actionable. Alert hygiene is ongoing, not one-off.
- New-service onboarding checklist: register a
CloudRoleName; add the three health endpoints and dependency checks with criticality; declare a starter availability + latency SLO; wire the golden-signal dashboard from the template; add alerts from the template into the right action group; confirm health traffic is filtered from telemetry.
Runbooks — what they are, and why they are part of this concept
There are no runbooks today; this concept introduces them, because they are what makes an alert actionable under a best-effort model — the person who picks up an alert may not be the person who understands it.
What a runbook is. A short, living document that tells whoever responds to an alert four things: what it means, how to confirm it is real, what to do first (mitigation steps), and when and how to escalate. It is a response guide for a human — not a diagnosis engine and not a substitute for judgement.
Are runbooks Azure-specific? No. "Runbook" is a general operations term that predates the cloud; a runbook is tool-agnostic and can live anywhere. One naming clash is worth calling out: Azure Automation has a feature literally called "Runbooks," but those are automation scripts (PowerShell/Python) — a different thing from what is meant here. Ours are human-readable response guides. Store them as Markdown in this repository, next to the alert-as-code definition (so a runbook change is reviewed in the same PR as the alert it belongs to), or in the Azure DevOps Wiki if that reads better for responders. Either is fine; the only hard rule is that the alert's notification links to it.
Why adopt them:
- They turn tribal knowledge into shared knowledge. With no formal on-call, whoever is available responds — a runbook lets a non-expert act correctly at 22:00.
- They are the concrete test of "is this actionable?" If you cannot write even a three-line runbook, the signal is probably a dashboard metric, not an alert (principle 3).
- They make response faster and more consistent — less rediscovery, fewer mistakes under pressure.
- They ease onboarding and continuity — new people can respond without shadowing an expert.
- They are useful compliance evidence — DORA expects documented ICT incident-handling; linked runbooks are exactly that (see audit-log-strategy.md).
How to keep them cheap enough to actually exist:
- Keep each short (about half a page) — a wall of text does not get read at 22:00.
- One per alert or alert class, linked from the alert's
description/ action group. Where a draft alert already carries a one-line context string in its--description, a runbook is the next step up from that. - Write them lazily but promptly: the first time an alert fires without a runbook, writing one is part of closing that incident. Do not try to author the whole set up front.
- Start each from a small template:
# Runbook: <alert name>
What it means:      <one or two sentences>
Confirm it is real: <query / dashboard / command to verify — link the golden-signal dashboard>
First steps:        <safe mitigation actions, in order>
Escalate:           <who / what, and when — e.g. unresolved in N min, or customer-facing>
Related:            <dashboards, KQL, upstream / downstream services>
Worked Example — eSign API (tis.gf.esign.api)
To make the end state concrete, here is what the concept produces for one real service. The eSign API is a good illustration: it is customer-impacting (a broker or customer signing a document), it has a genuine external dependency (the Namirial e-signature service), and it talks to a database. A May 2026 review of the Windows event logs found its Namirial callback throwing on the order of 96 unhandled exceptions a day with no alert configured. The same shape applies to any service. Names and thresholds below are illustrative.
Instrumented to the golden-signal contract
Application Insights is already in place; the new part is the health contract, wired once via the proposed Tis.Hosting.Extensions helper:
builder.AddTisApplicationInsightsTelemetry("esign-api");

builder.Services.AddTisHealthChecks()   // gives /health/live, /health/ready, /health;
                                         // runs checks on a 30s publisher; filters /health* out of telemetry
    .AddSqlServer(esignDbConnString, name: "esign-db", failureStatus: HealthStatus.Unhealthy)  // critical dependency
    .AddUrlGroup(namirialHealthUri,  name: "namirial", failureStatus: HealthStatus.Degraded);   // external: visible, not fatal
The team decides what "healthy" means: DB down = Unhealthy (cannot work), Namirial down = Degraded (stays in the pool so signing can queue/retry, but it is visible). The publisher emits one health datapoint every 30 s; probe traffic never touches the DB or pollutes telemetry.
Service level objectives
| SLI | SLO (28-day) | Source |
|---|---|---|
| Request success rate | ≥ 99.5% | AppRequests where AppRoleName == "esign-api" |
| Signing-initiation latency (p95) | under 1.5 s | AppRequests duration |
Error budget = 0.5%. Internal targets, not a customer SLA.
One dashboard (golden signals + causes)
A single "eSign API — Golden Signals" dashboard, one row each: Latency (p50/p95/p99), Traffic (req/s), Errors (rate + top exception types), Saturation (TISAPP03 CPU/memory, thread pool, disk — this is where CPU lives; it never pages), Dependencies (Namirial success rate + latency, DB health), and Health + SLO (current verdict, error-budget burn-down).
Alerts — few, symptom/SLO-based, delivered by severity
| Signal | Sev | Delivery |
|---|---|---|
| Success-rate fast-burn (customers cannot sign) | Sev1 | Push to ag-prod-critical (Prod-Probleme + email) |
| p95 latency SLO breached and sustained; or Namirial Degraded beyond 15 min | Sev2 | Push to ag-prod-standard (Monitoring - PROD + email) |
| Exception rate elevated but below customer impact | Sev3 | Daily digest + dashboard; auto-escalates to Sev2 if the rate crosses the impact line |
High CPU, individual exceptions, and single slow requests are not alerts — they are panels on the dashboard.
It is all code, in one place
The alert lives next to its runbook in git and deploys by pipeline, parameterized so Fachtest gets a lighter variant:
resource esignAvailability 'Microsoft.Insights/scheduledQueryRules@2023-03-15-preview' = {
  name: 'esign-${env}-availability-slo-burn'
  properties: {
    severity: 1
    scopes: [ logAnalyticsWorkspaceId ]
    criteria: { allOf: [ {
      query: '''AppRequests
        | where AppRoleName == "esign-api"
        | summarize total=count(), failed=countif(Success==false)
        | extend successRate = 100.0*(total-failed)/total
        | where successRate < 99.0'''
      timeAggregation: 'Count', operator: 'GreaterThan', threshold: 0
    } ] }
    actions: { actionGroups: [ actionGroupCritical ] }   // Teams + email
  }
}
The linked runbook (from the template in the Runbooks section):
# Runbook: eSign API — availability SLO burn (Sev1)
What it means:      Success rate is burning the error budget — customers likely cannot complete signatures.
Confirm it is real: Open "eSign API — Golden Signals"; check the Errors and Namirial panels.
First steps:        1) Namirial panel red?  -> upstream outage, post status, no code fix.
                    2) Recent deploy?        -> check Deployments panel, consider rollback.
                    3) TISAPP03 saturated?   -> check the Saturation row.
Escalate:           Not upstream and not resolving in 15 min -> ping the app owner on Prod-Probleme.
Related:            eSign golden-signal dashboard - Namirial status page - TISAPP03 in Azure Arc
How this would have surfaced the Namirial exceptions
This is a real, current example — not a hypothetical. The May 2026 review of the Windows event logs found the eSign API's Namirial callback throwing about 671 unhandled exceptions over seven days, with no alert configured and a DeveloperExceptionPage leaking stack traces in production — all of it unnoticed, because nothing was watching that signal. Under the model in this concept:
- The exception spike feeds the Errors golden signal and lands in the Sev3 daily digest — surfaced at the next standup instead of going unseen.
- The Namirial dependency health check answers the first question every responder asks — is it us or them? — instantly; if Namirial is Degraded it is upstream, and nobody wastes an hour chasing a bug.
- If it escalated to customers actually failing to sign, the availability SLO burn fires Sev1 (push).
- (The
DeveloperExceptionPage-in-production bug is a code fix surfaced in review — not an alert — but the exception visibility is what makes someone go and look.)
Alternatives Considered
| Alternative | Pro | Contra | Disposition |
|---|---|---|---|
| Leave it as-is | No effort | The islands, blind spots, and Fachtest gap persist and compound | Rejected — this is the problem statement |
| Formal on-call tool now (Opsgenie/PagerDuty/Grafana OnCall) | Guaranteed escalation | No business mandate for 24/7; premature cost/process | Deferred — clean upgrade path retained |
| Replace App Insights with a third-party APM (Datadog, etc.) | Single vendor | Discards a working, integrated, paid-for investment; migration cost | Rejected |
| Grafana-owned alerting instead of Azure Monitor | One tool for dashboards + alerts | Splits alerting from the Azure-native rules and action groups already in use | Optional, only if a Grafana decision is made deliberately |
| Azure Monitor managed Prometheus for metrics | Prometheus ecosystem | Not needed given current Azure Monitor metric coverage; added complexity | Not now |
Dependencies, Constraints, Risks
- Constraint — database access stays on-premises (calibrated). Not an absolute ban on cloud connectivity: Arc's outbound channel is accepted and used. The real limits are (a) no inbound network path to on-prem SQL for cloud tools, and (b) query execution stays on-prem, pushing results outward. See principle 4.
- Constraint — best-effort staffing. No guaranteed on-call; response targets are intent, not SLA.
- Dependency — Arc/DCR coverage gaps. A review of event-log collection found real coverage defects (for example
TISWAP001shipping to the Fachtest workspace,tisweb02missing IIS logs,TIS-OMDScollecting no events). Alerting is only as good as collection — these should be fixed as part of, or before, Phase 4. See windows-event-log-review-2026-05.md.- Risk / cost — Log Analytics ingestion and retention. More alerting and longer retention increase cost; align retention with audit-log-strategy.md and watch high-volume sources. - Cost — dashboard tool. Managed Grafana carries a monthly cost (≈ $60 per instance + ~$6 per active user, per subscription); Workbooks do not. Feeds the visualization decision.
- Dependency — tool/IaC decisions. Phases 3 and 6 are gated on the visualization and IaC-tool choices.
Success Criteria
- A published one-page rule for alert-vs-dashboard, adopted by all teams.
- The number of action groups reduced to the standard named set; no
Test/Migration/Recommendedgroups routing production alerts. - Every production alert is code-defined, owned, and links a runbook.
- Fachtest has proportionate alerting (partner-impacting Sev1/Sev2 notify).
- At least one pilot service fully instrumented to the model (golden-signal dashboard + health contract + SLOs + alerts), end to end.
-
tis.monitoring.dashboardis resolved — retired into the chosen dashboard tool, or slimmed to an on-prem publisher — with its private email path gone. - A maintained inventory of former islands, each marked migrated or retired.
- Health-check traffic verifiably contributes ~0 to request telemetry and logs.
Roadmap
Phased, dependency-aware. Durations are indicative.
| Phase | Focus | Key outputs | Depends on |
|---|---|---|---|
| 0 — Discovery | Inventory every alerting mechanism | Catalogue with disposition per island | — |
| 1 — Foundations | Taxonomy, severity, naming, standard action groups | Published rules; ag-{env}-{tier} groups created as code | 0 |
| 2 — Health standard | Health contract in Tis.Hosting.Extensions + noise controls + pilot service | Library support; one service fully onboarded | 1 |
| 3 — Visualization | Decide tool; build golden-signal dashboard template | Tool chosen; first dashboards | 1 (tool decision) |
| 4 — Migrate islands | Re-home keepers as code; monitoring app publishes outward; Fachtest baseline; fix Arc/DCR gaps | Islands retired; Fachtest alerting live | 1, 2, 3 |
| 5 — SLOs | Starter SLOs per service; SLI dashboards; move toward burn-rate alerts | SLOs defined; SLO alerts | 2, 3 |
| 6 — IaC + governance | Everything as code; review cadence; onboarding checklist enforced | Full IaC coverage; governance in place | all |
Open Questions / Decisions Needed
| Question | Context | Needed by |
|---|---|---|
| Visualization tool — Managed Grafana vs Workbooks/Dashboards? | Cost vs single-pane UX; see the comparison table | Phase 3 |
| IaC tool — Bicep vs Terraform? | Default recommendation is Bicep; confirm platform-team standard | Phase 1 |
| Starter SLO targets per service? | Each team proposes availability + latency; needs a first pass | Phase 5 |
tis.monitoring.dashboard — retire into on-prem Grafana, or slim to a publisher? | Depends on the visualization choice (principle 4); also needs an owner | Phase 3–4 |
| Cost budget for Log Analytics retention + Grafana? | Bounds retention and tool choice | Phases 3–4 |
| How deep should Fachtest alerting go? | Partner-relevant but not customer-facing; Sev1/Sev2 proposed | Phase 4 |
| Fold the Arc/DCR coverage fixes into this or track separately? | Alerting depends on correct collection | Phase 4 |
Next Steps
- Stakeholder review of this proposal (Platform/Ops, Architecture, Dev Leads, Security).
- Decisions on the open questions above — at minimum the visualization tool and IaC tool.
- Run Phase 0 discovery to produce the island catalogue.
- Pick a pilot service for Phase 2 and instrument it end to end as the reference.
- Graduate this document from proposal to living strategy (alongside audit-log-strategy.md) once approved.
Appendix
References
- Google SRE Book — Monitoring Distributed Systems (the four golden signals): https://sre.google/sre-book/monitoring-distributed-systems/
- Rob Ewaschuk — My Philosophy on Alerting (symptom-based alerting): https://docs.google.com/document/d/199PqyG3UsyXlwieHaqbGiWVa8eMWi8zzAn0YfcApr8Q/edit
- Google SRE Workbook — Alerting on SLOs (burn-rate): https://sre.google/workbook/alerting-on-slos/
- ASP.NET Core Health Checks: https://learn.microsoft.com/aspnet/core/host-and-deploy/health-checks
- Azure Monitor — alerts and action groups: https://learn.microsoft.com/azure/azure-monitor/alerts/alerts-overview
- Azure Managed Grafana: https://learn.microsoft.com/azure/managed-grafana/overview
Related documents
- monitoring-logging.md — the data-collection plane (App Insights, Serilog/Fluent Bit, IIS/Event logs, request logging)
- audit-log-strategy.md — Azure platform / audit logging for DORA / NIS2
- windows-event-log-baseline.md — per-role Windows Event Log DCR baseline
- windows-event-log-review-2026-05.md — point-in-time review of Windows event-log collection; source of the "no alerting" finding and the draft alert set
- azure-arc-onboarding-plan.md — server onboarding
logon-monitoring-loganalytics.md— in-flight logon-auditing proposal (a first consumer of this model)
Review Notes:
| Date | Reviewer | Feedback | Status |
|---|---|---|---|
| YYYY-MM-DD | Open |